Location of BotTabCluster in the project and a general description of capabilities.

The BotTabCluster tab allows you to build trading systems based on cluster analysis of the chart. A cluster chart is a way of displaying exchange information in the form of bar charts, each of which is divided into several sections. Each bar is called a cluster, which corresponds to one candle and represents a visualization of the distribution of trading volume within the candle. In other words, it's an "X-ray" of the candle. It is worth noting that clusters are built based only on the flow of anonymous transactions. For clarity, let's consider the cluster chart of the terminal:
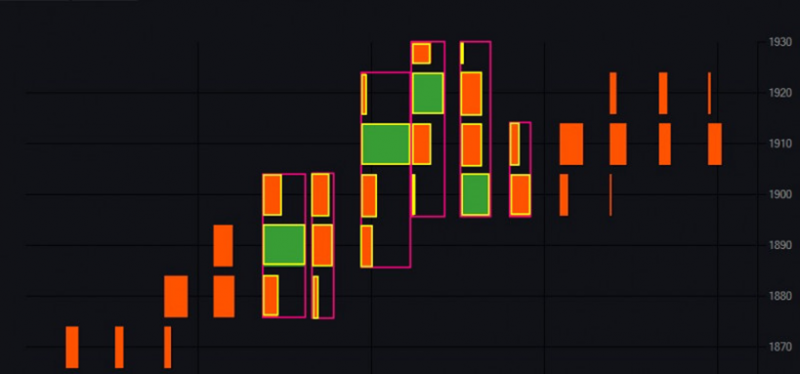
Fig. 1. Display of clusters and sections on the chart.
Some clusters are highlighted in pink, each of which corresponds to one candle. Sections (lines) inside the clusters are highlighted in yellow. If you hover the mouse over a section, a tooltip with additional information will pop up:
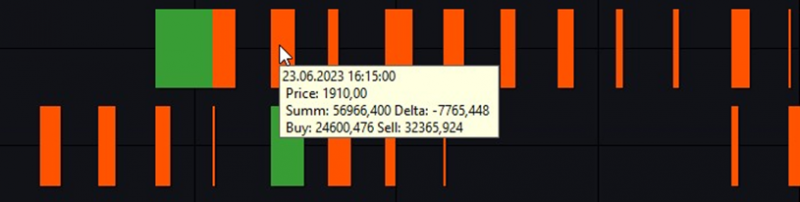
Fig. 2. Additional information about the section.
Let's break down this information in detail:
1. In the first line, the date and time of the candle.
2. Price – the price of the middle of the section.
3. Summ – the total volume of buyers and sellers that has passed through this level.
4. Delta – volume delta. The difference between buyers and sellers.
5. Buy – volume of purchases that has passed through this level.
6. Sell – volume of sales that has passed through this level.
For comparison, the same section of the candlestick chart:
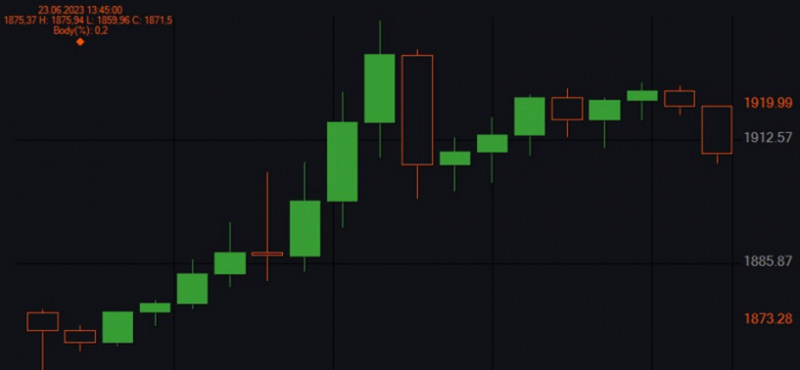
Fig. 3. Candlestick chart profile.
The file with the code of the BotTabCluster class in the project is located in the folder: OsEngine\project\OsEngine\OsTrader\Panels\Tab\
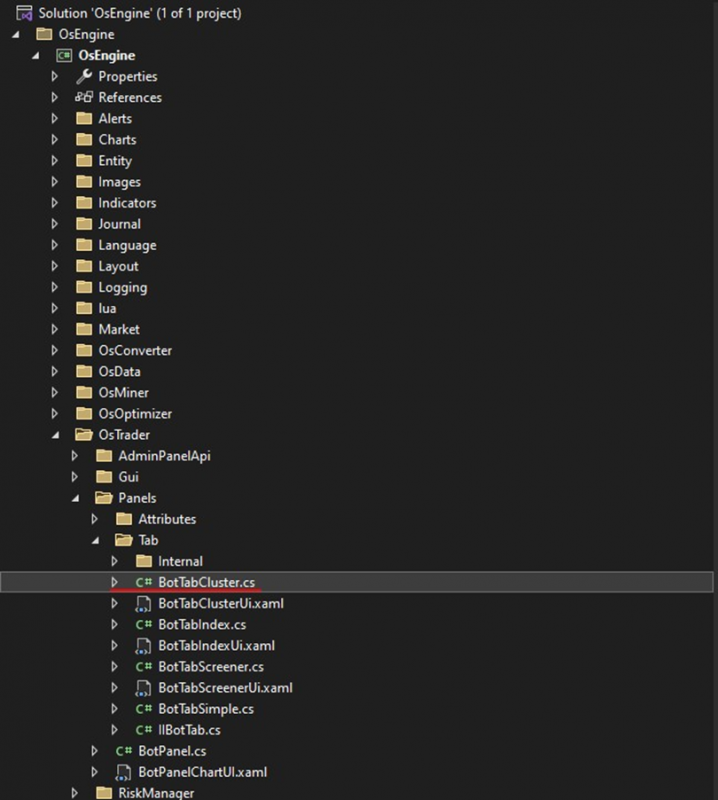
Fig. 4. Location of BotTabCluster in the project structure.
If you have any difficulties or questions, please write to the support chat. Link