Creating an Indicator within OsEngine.

Let's consider an example of creating a simple indicator. Its essence will be the calculation and display of the midpoint of the last closed trading day as a series of points.
For convenience, we'll create a folder for custom indicators and then create a LastDayMiddle class within it.
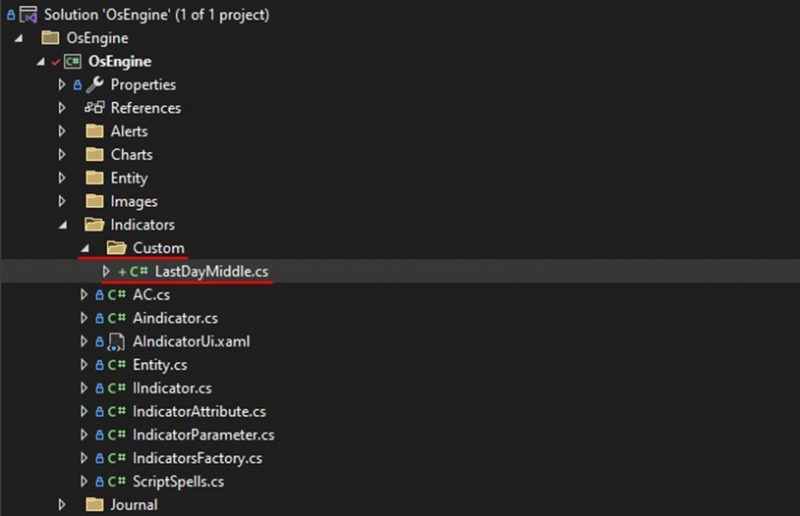
Fig. 1. Creating a new indicator.
We will set the created class to inherit from the Aindicator class and implement its abstract methods using the studio:
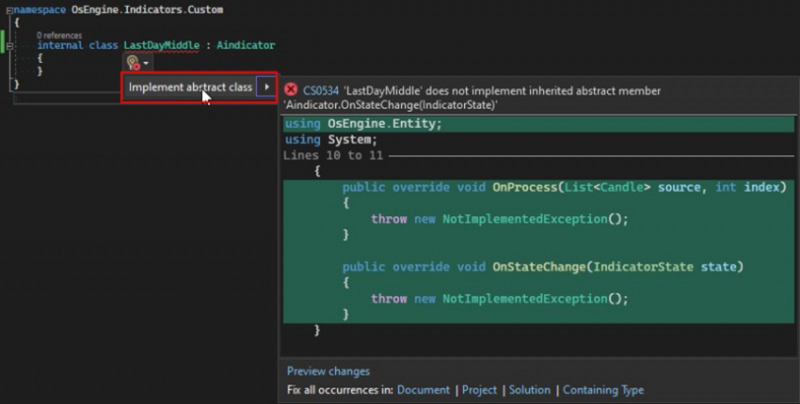
Fig. 2. Implementation of the abstract class.
To ensure OsEngine can load our indicator, we need to add an IndicatorAttribute class attribute and pass the name of the indicator to it. After the steps carried out, you should end up with the following template:
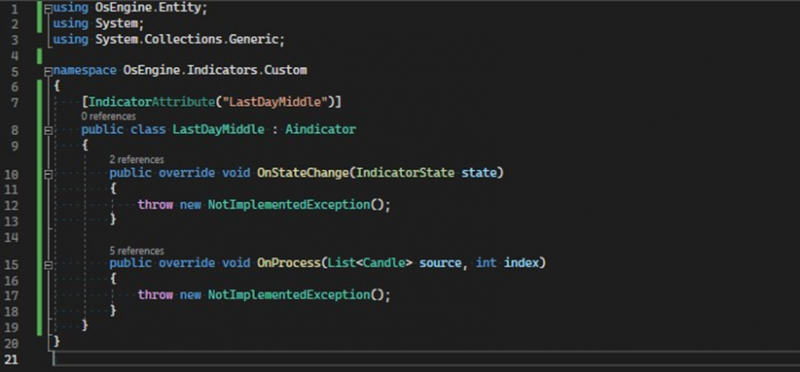
Fig. 3. Template for the indicator.
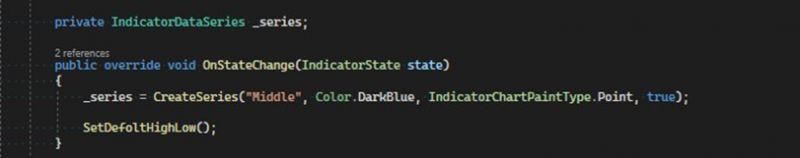
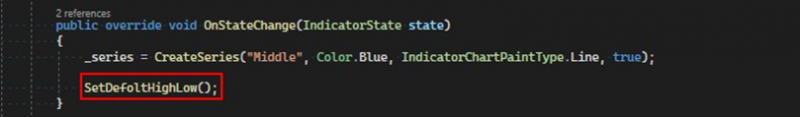
The OnStateChange method is called once after the object is created. Here, you can perform the creation of necessary data series and parameters. Our indicator will contain one data series. Let's add a private field of type IndicatorDataSeries and name it _series. Next, we'll initialize it by calling the CreateSeries method of the base class.
The following parameters need to be passed to this method:
1. name – a unique name within the indicator for the series. It will be displayed in the settings window, with which we'll become acquainted later;
2. color – the color of the data series, which it will be painted on the chart;
3. chartPaintType – the way the series is displayed on the chart. A line, bar chart, or series of points;
4. isPaint - a flag indicating whether the indicator should be displayed on the chart.
The OnProcess method is called by the program each time the data source is updated. Therefore, all the logic for calculating the indicator values should be performed here. The method takes a series of candles and the index of the candle currently being processed as arguments.
An important note.
Here, it is very important to understand one detail. If you need to get a candle at a certain index, ALWAYS use the value of the index parameter for this. We'll cement this information with a visual example. This is acceptable and necessary:
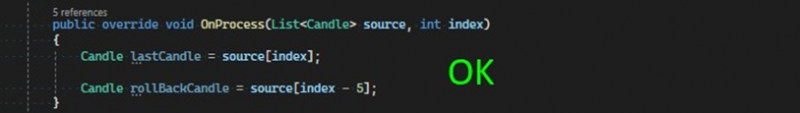
Fig. 4. The correct way to access collections.
And here’s what you should not do:
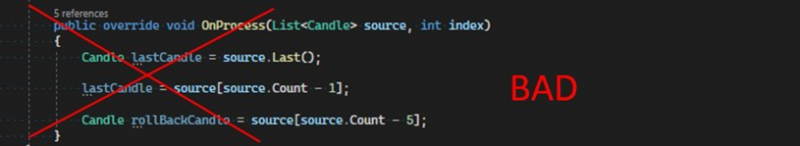
Fig. 5. An incorrect method of accessing collections.
The same applies to accessing your data series and the series within internal indicators.
Implementing the logic for calculating indicator values.
Let’s continue writing our indicator. Although we are calculating the average price of the last closed day, this value should be displayed as the latest indicator values. In other words, if you access the last value of the indicator from the robot, we should get the calculated value of the middle of the previous day. Before we move on to the logic of calculation, let's consider the variables we will need for our computations:
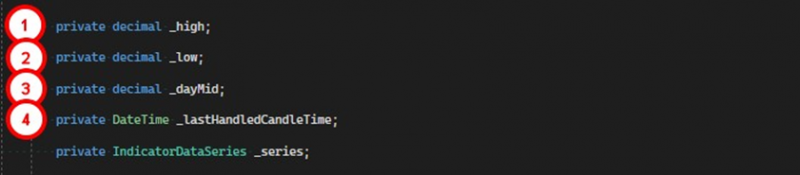
1. Holds the current day's maximum reached.
2. Holds the current day's minimum reached.
3. Holds the value of the middle of the last closed day.
4. The time of the last processed candle.
On to the logic:
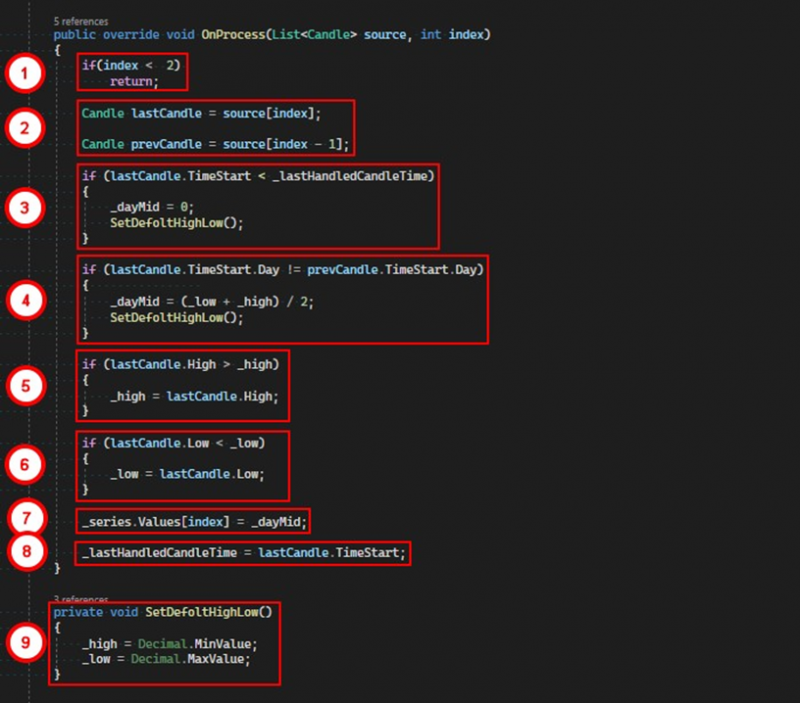
1. If the index of the candle being processed is less than two, we exit the method.
2. Save references to the last and penultimate candles being processed.
3. Compare the opening time of the last candle with the time of the last processed candle; if it's less, this indicates that the process of recalculating the indicator has started. We need to reset the values of global variables. To do this, we set _dayMid to zero and call the SetDefoltHighLow method.
4. Compare the days of the last and penultimate candles. If they differ, it means a new day has started, and we need to set a new value for the middle of the previous day. We do this by adding the maximum and minimum of the previous day and dividing by two, then calling the SetDefoltHighLow method.
5. Save the new maximum of the current day if it has been updated.
6. Save the new minimum of the current day if it has been updated.
7. Set the middle of the previous day as the latest value of the indicator's data series. Note that the same index passed to the method is used to access the last value.
8. Update the processing time of the last candle.
9. The SetDefoltHighLow method sets the values we need for the _high and _low variables. The minimum value of the decimal type for the maximum and the maximum value of the decimal type for the minimum. This is necessary so the first candle within the new day can set its high and low, respectively.
We will also add a call to the SetDefoltHighLow method in the OnStateChange method:
That completes the process of creating the indicator, and no further actions are necessary for the terminal to use our indicator.
Adding the indicator to the chart.
To add the indicator to the chart, you need to call the context menu with the right mouse button on the chart area:
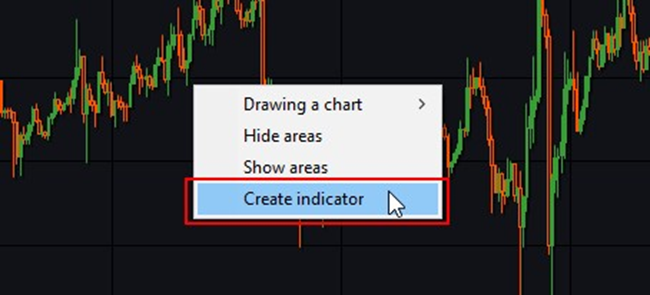
Fig. 6. Adding an indicator to the chart.
A new window will open in which you need to do the following:
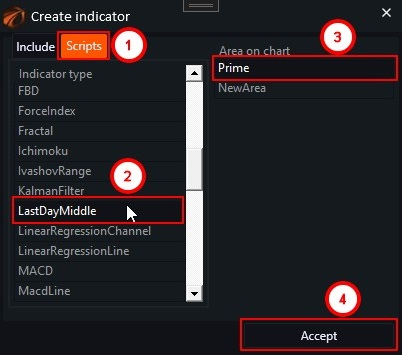
Fig. 7. Indicator creation window.
1. Go to the "Scripts" tab.
2. Find and select our indicator.
3. Select the "Prime" area.
4. Click the "Accept" button.
A new window will open with all the settings of the indicator. If we go to the "Visual" tab, we will see the settings of the only data series we created in the code. Here you can adjust the color of the series, the display type, and the visibility of the indicator. We will become acquainted with other tabs in subsequent articles, but for now, they will be empty.
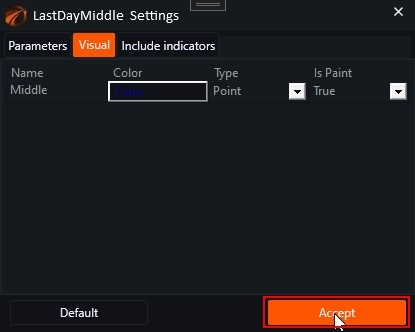
Fig. 8. Indicator settings window.
By clicking the "Accept" button, we will finally see our indicator on the chart:
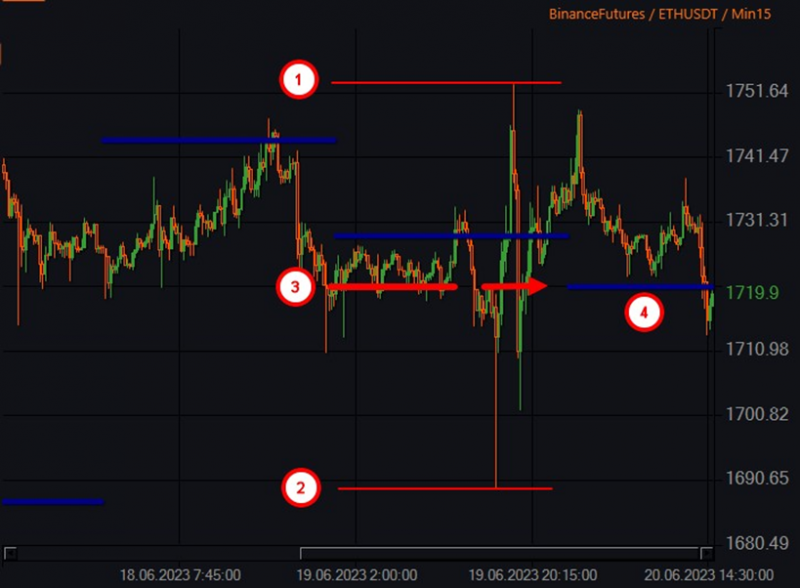
Fig. 9. Displaying the indicator on the chart.
Our indicator is displayed in blue, red lines are drawn for comparison.
1. Maximum for the day.
2. Minimum for the day.
3. Visually distinguishable middle.
4. Indicator line reflecting the middle of the previous day.
You can download the code for this indicator using the link.
If you have any difficulties or questions, please write to the support chat. Link